

Between the start of June and the middle of August, Card Ladder’s soccer index fell 5%. Over exactly the same weeks the CL50, Card Ladder’s fifty-card blue-chip benchmark, rose 16% and its basketball index rose 25%.
In between those two dates, soccer played its World Cup.
Look at the players instead and the picture changes again. Lionel Messi finished second in the scoring table on eight goals and four assists, took the Silver Ball and played in his third World Cup final; his index moved one percent, down. His most-traded card, over the identical window and in the same database, rose 16%.
Both numbers come from Card Ladder, which aggregates publicly recorded sales and is what most of this hobby prices off. Both cover identical dates. They do not agree, and for most of the players below they do not agree either.
That is what this piece is about: what each of the two numbers actually measures, and which one answers the question you are asking. Everything runs on one window, 1 June to 18 August 2026 — the ten days before kick-off, the tournament, and the month after the final. The start is the first day of the month in which the tournament began.
What the Indexes Say
Thirteen players, plus three category indexes for context.
The kick-off column is there as a marker, not as a baseline: every percentage in the table is measured from 1 June. Read from kick-off instead, Kane would show +51% rather than +13%, because his index had already fallen a quarter in the ten days before the tournament began. Which start date you pick changes who the biggest gainer was.
The bottom three rows are the finding that survives everything else in this piece. The soccer index finished the World Cup 5% lower than it started it, while the CL50 blue-chip benchmark added 16% and basketball added 25%. Soccer went backwards by twenty-one points against the benchmark and thirty against basketball, during the eleven weeks it had the world’s attention.
The individual rows say something less tidy. Mbappé, Haaland and Bellingham all show large gains — and all three were out before the final was played. The two names the tournament was actually about barely register. Messi produced eight goals and four assists, more goal involvements than in any of his five previous World Cups, and his index fell 1%. Yamal won the trophy at nineteen, with one goal and no assists, and his fell 4%. From the index alone you would not know either of them had been there.
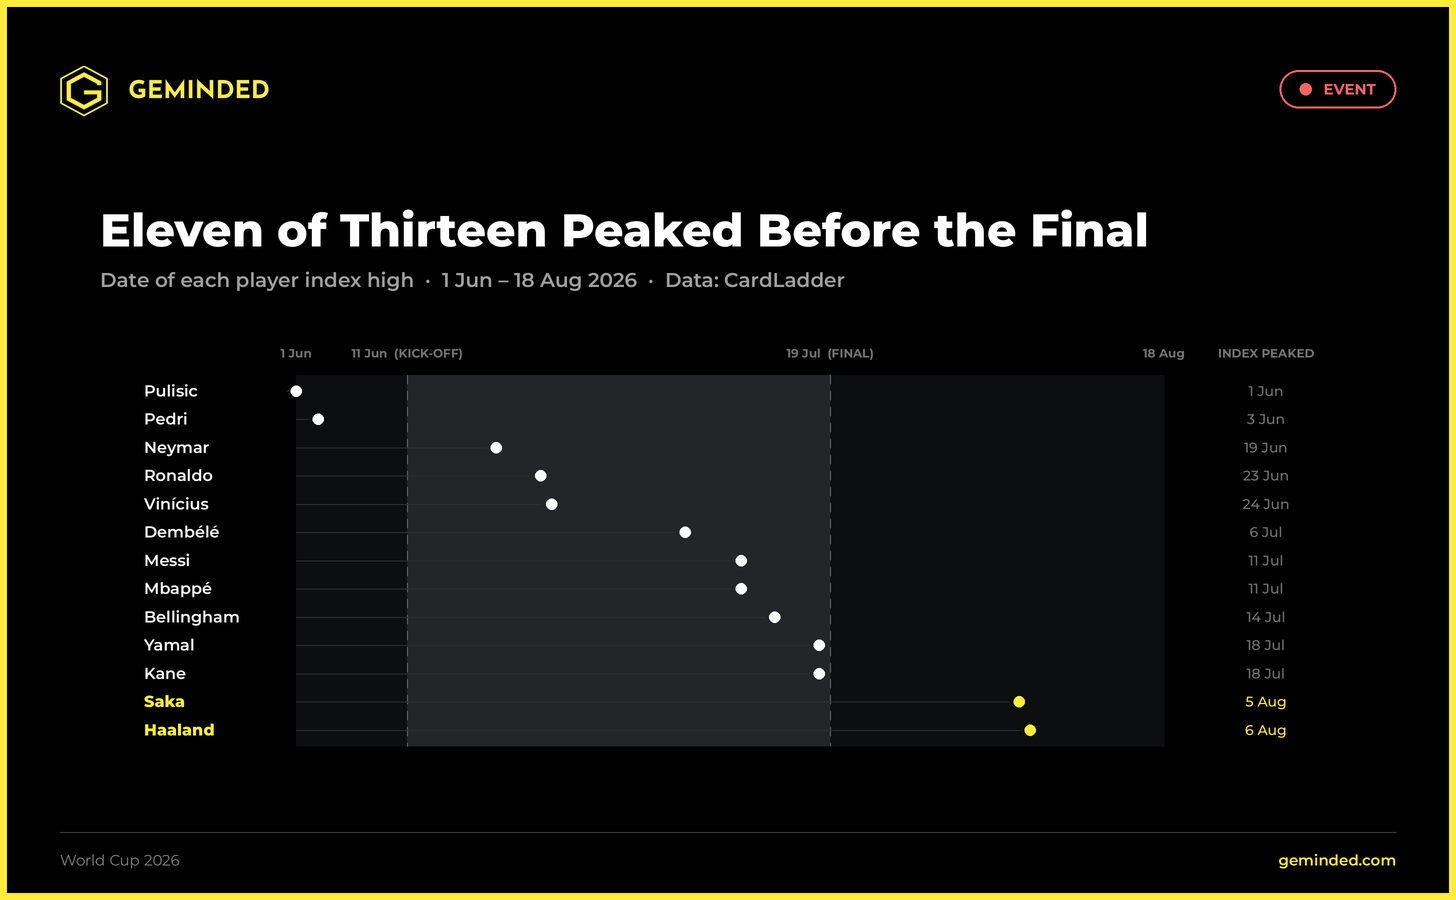
And eleven of the thirteen peaked before the final was played. Only Haaland and Saka peaked after it, both in August.
What the Sales Say
The same window, measured on transactions instead. One card per player, picked by the same rule for everyone: a card that already existed before the World Cup, so this measures repricing and not a new release, and of those the one with the most sales on record. Median price in the ten days before kick-off against median price in the month after the final — same card, same grade, both times.
Five of the thirteen cannot be measured, and that is worth as much as the eight that can. Kane and Vinícius had no recorded sales at all on their most-traded card in the ten days before a World Cup. Dembélé had none in the month after it. These are not obscure players, and these are their busiest cards.
Of the eight that can be measured, seven finished higher than they started. The exception is Pulisic, whose card lost half its value; the United States went out in the round of sixteen to Belgium, which is where they have gone out four World Cups running.
Two of the eight rest on very little. Haaland’s before-figure is 3 sales, Bellingham’s and Neymar’s are 5. Mbappé, Messi, Yamal and Ronaldo sit on 17 to 21 before and 28 to 69 after, and those four carry whatever the table can carry.
Side by Side
The same eight players, the same two dates at either end, two measures.
They are not built the same way, and that has to be said before you read the table. An index is a value on a given day. A card figure is a median across a stretch of days. The index is read on 1 June and again on 18 August. The card is the median of whatever sold in the ten days before kick-off, set against the median of whatever sold in the month after the final — which means the tournament itself falls between the two card windows and inside the index one. Neither can be converted into the other. That is the point of putting them side by side.
What the table shows is not which measure is higher. It is how far apart they land on the same player: two columns that should tell a similar story about the same eleven weeks, and mostly do not.
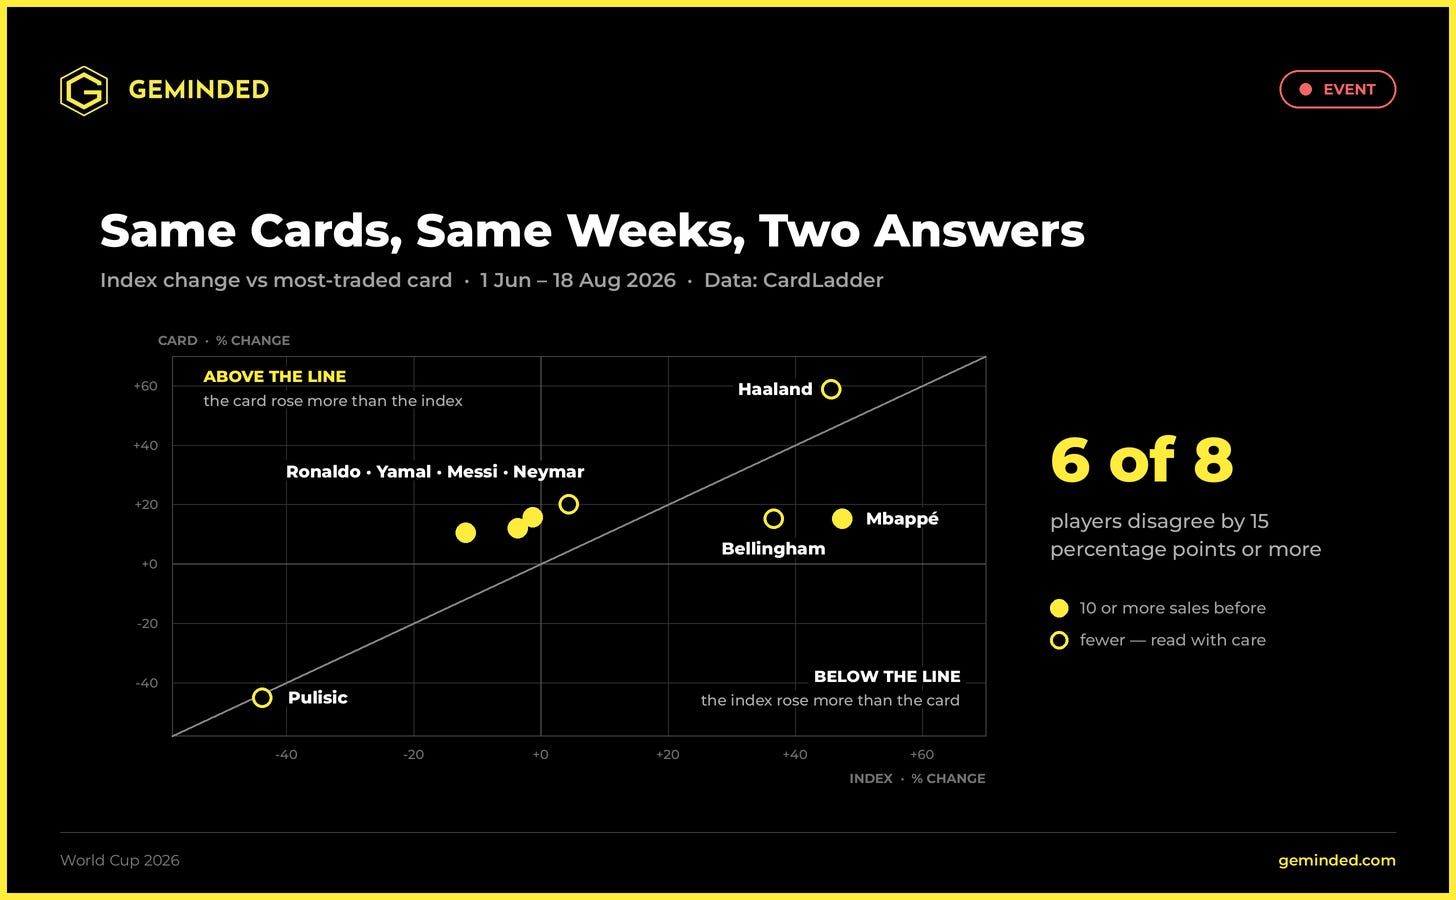
Two of the eight land close enough to call it agreement: Pulisic and Haaland. The other six do not, and they miss in both directions. Nor do the points sit around any line of their own — Ronaldo’s index fell 12% while his card rose 11%, Mbappé’s index rose 47% while his card rose 15%. Knowing what one measure did tells you very little about the other.
For Mbappé and Bellingham the index rose two to three times as much as the card. For Messi, Yamal and Ronaldo the index fell while the card rose. Ronaldo is the sharpest version: his World Cup career ended in the round of sixteen, Spain beat Portugal 1–0 with a ninety-first-minute goal, and his index dropped 12% — while the card of his that trades most often went up 11%.
One of those two numbers is wrong for whatever question you are asking. The next section is which.
Two Different Measurements
They disagree because they are not measuring the same thing, and Card Ladder publishes exactly what its own measure is.
A player index is the sum of every eligible card’s last sold price, divided by the card count, then divided by a fixed divisor. Card Ladder compares the construction to the S&P 500, and points to S&P Global’s own methodology for how the divisor works. That makes it a price average of a fixed set of cards, and it answers the question what does the last recorded price of these particular cards add up to today.
That is a legitimate question. It is also not the question most people think they are asking, which is what were people paying over this period. The sales answer that one, because they are transactions: dated, priced, one card at a time.
Three properties follow from the way an index is built, and all three showed up here.
A big card carries the whole thing. Messi’s tracked market is $83.45m of the soccer index’s $181.85m — 46% of a sport in one man. That does not make the soccer index a Messi index; the daily correlation between the two is 0.47, and on 22 of 78 days they moved in opposite directions. But it does mean the soccer index is roughly half one player, and no single-name weighting like that survives being read as “how soccer is doing.”
Two caveats on that percentage, because it divides one Card Ladder total by another: the soccer index holds 1,880 cards while the 47 player indexes hold 1,564 between them, and cards carrying more than one player can sit in more than one index. Read 46% as close, not exact.
The history moves after it is published. On 18 July I published Messi’s July high as 152,047. That figure does not appear anywhere in his current series. The highest value it now carries for July is 135,153, eleven percent lower, on a date that has not changed and a sale that did not happen. This is Card Ladder’s own documented behaviour, not a malfunction: when new cards are verified into an index, the history is recalculated so the whole series stays internally consistent. It is defensible as a method and inconvenient as a measurement.
One day can outweigh eleven weeks. The soccer index fell 11.6% on 13 June, two days after the opening match. That single day is larger than the entire eleven-week move; take it out and the window turns positive. Across the thirteen players there were 32 single-day moves above 8% in 78 days, including Dembélé +33%, Mbappé +30% and Bellingham +28%. Nothing in the sales data explains days like that.
None of the three is a fault. They are what a price average of a fixed card set does, and any index built this way would do the same. They are also why an index is a good instrument for tracking a defined basket over years and a poor one for measuring what a single event did over a few months.
The disagreement is not telling you the index is broken. It is telling you that you are asking a different question from the one it answers.
What Neither Table Shows
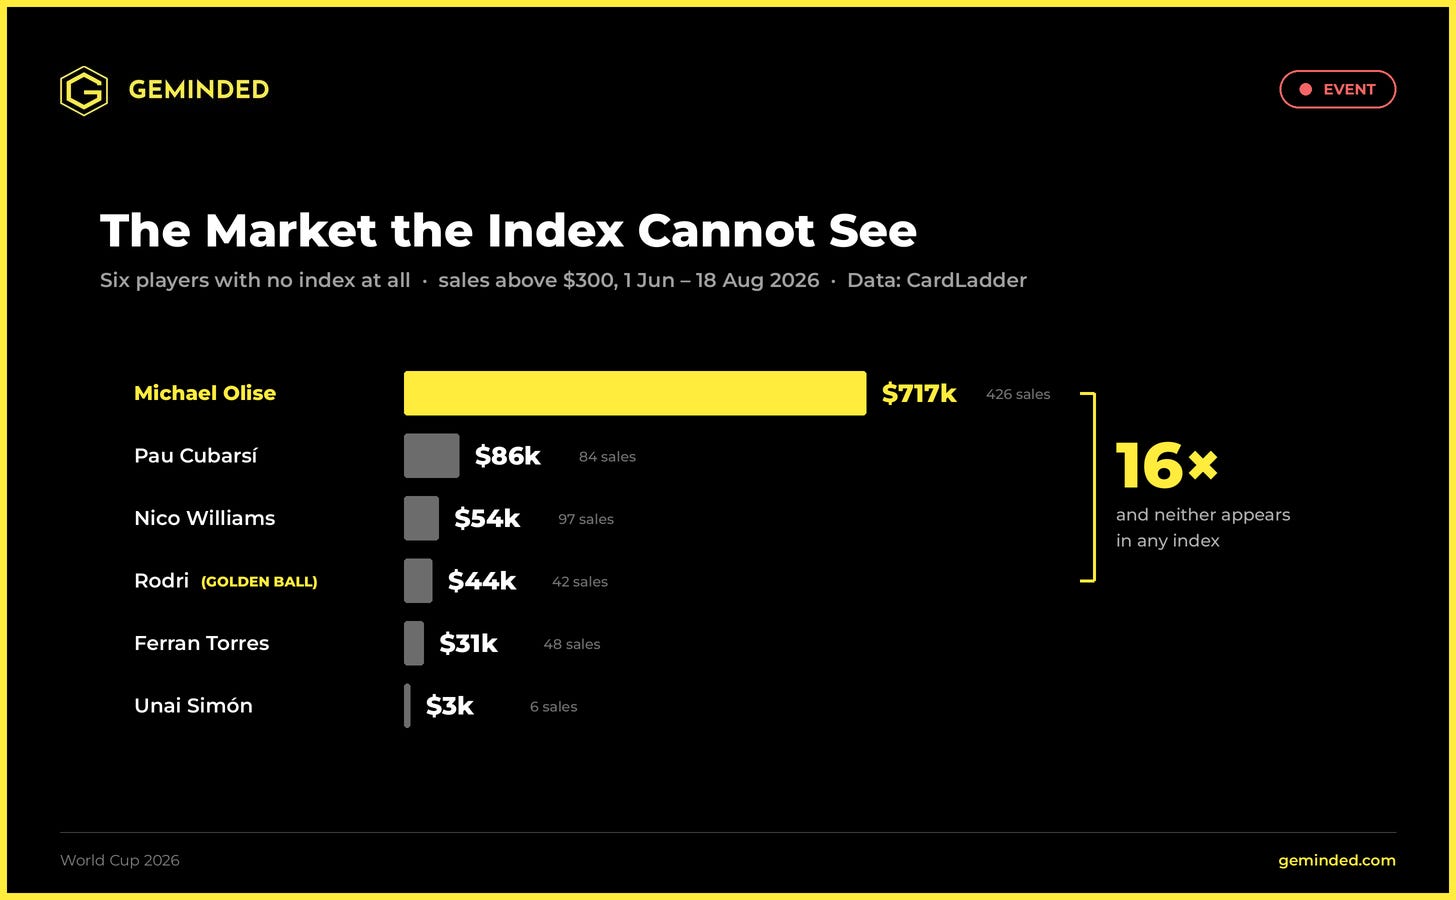
There is a third layer. Six players central to this tournament have no index at all, and no verified card in Card Ladder’s database. Their sales still happen; they simply are not counted anywhere. Every sale above $300 in the same window, excluding cards that carry two players:
Olise’s single largest sale was $40,100, a 2025-26 Donruss Road to FIFA World Cup 26 Kaboom Gold. Rodri’s was $9,194. Rodri was voted the best player of the World Cup. Bellingham, who does have an index, has a tracked market of $841,710 across 73 cards in total — and Olise, who has no index, traded almost that much in eleven weeks.
Dembélé shows the same thing from the other side. He does have an index, built on six verified cards which are all variants of the same 2018 Prizm World Cup #85. Across all six, his entire record after the final is two sales: $7.00 on 19 July and $4.99 on 28 July. Search the sales history for his name over that same period and it returns 1,354 results, from $0.78 up to $5,040 — the top three all one-of-ones. His market is not quiet. Almost none of it sits on cards the database has verified, so almost none of it reaches his index.
Whether a player appears in an index is not a statement about the size of his market. It is a statement about what has already been catalogued.
What to Do With It
Find out what an index is made of before you read it as a market. Forty-six percent in one name means the soccer index is telling you a great deal about Lionel Messi and much less about soccer as a category.
Ask for the absolute behind the percentage. Rodri’s sales rate rose sharply after he won the World Cup. His entire market above $300, across the whole window, was $44,000.
Treat an index value as a reading, not a fact. The July high I published as 152,047 now reads 135,153 for the same month. If you are quoting a number from July in September, check that it still says what it said.
And when the two disagree, go to the transactions. A recorded sale has a date, a price and a platform. An index value has a method, and the method was not designed to answer what one summer did.
So: which of your cards is priced on a number you have checked, and which on one you have assumed?
Reply directly to this piece — I read every response.
Index values and sales data read from Card Ladder on 19–21 August 2026. Cards are drawn from Card Ladder’s verified card database, the same set the indexes are built from, which makes this a like-for-like comparison over the same cards rather than a broad survey of each player’s market.
— Geminded
Great piece. Messi being nearly half the soccer index is like the S&P 500 being half one company — at that point "soccer fell 5%" tells you almost nothing about soccer. And the index history being rewritten retroactively is wild. One question: did you try a volume-weighted average instead of the median for the sales? For the players with 20+ sales it might show whether the gains were driven by the cheap cards or the expensive ones.